Linking Intensity Measures of Powered Wheelchair Use With User-perceived Outcomes
Philippe Archambault, OT, PhD1-2 , Claudine Auger, OT, PhD candidate3-4, François Routhier, PEng, PhD5, Louise Demers, OT, PhD 3-4 , and Patrick Boissy5-6 , PhD
1-School of Physical & Occupational Therapy, McGill University; 2-Centre for Interdisciplinary Research in Rehabilitation of Greater Montreal (CRIR); 3-School of rehabilitation, Université of Montréal; 4-Resarch Center of the Montreal Geriatric University Institute; 5-Center for Interdisciplinary Research in Rehabilitation and Social Integration (CIRRIS); 6-Research Centre on Aging, Sherbrooke, Canada; 7-Dept. Kinesiology, Sherbrooke University, Canada
ABSTRACT
Understanding the impact of powered wheelchairs (PWCs) on activities and participation of users requires a better characterization of their driving habits in various indoor and outdoor settings and consideration of user-perceived PWC outcomes as well. The purpose of this pilot study was to field test a system that can monitor multiple intensity parameters of PWC use (e.g. time sitting and driving, driving locations, distance covered) and to explore the link between these intensity measures and user-perceived PWC outcomes (e.g. satisfaction with PWC, satisfaction with participation). Three case studies of middle-aged adults with locomotor impairments showed that it was possible to monitor PWC use with acceptable data quality over a period of one week, and that user-perceived outcomes complement that information.
KEYWORDS
Powered wheelchair, wheeled mobility, monitoring system, satisfaction, wheelchair outcomes
BACKGROUND
Understanding the impact of powered wheelchairs (PWCs) on the participation of users requires a better characterization of the users’ driving habits in various indoor and outdoor settings. Measuring PWC use is complex and influenced by factors at the level of the person, the assistive device, the intervention and the environment (1). Some authors report usage of assistive devices as an 'intensity of use’, defined as the amount of use per unit time, such as number of hours per day (2, 3), number of days per month (4) or distance covered per day (3, 5). However, these intensity measures cannot fully capture PWC driving habits, as they lack the dimension of ‘intention to use’. Intention to use depends on personal factors such as residual capacities, changing needs (6-11) , preferences and types of activity performed (12), which in turn determine user-perceived outcomes. In this context, the characterization of PWC driving should encompass intensity of use, as well as user-perceived outcomes in different environmental contexts (13-15) .
RESEARCH OBJECTIVES
The objectives of this paper were: 1) to monitor the intensity parameters of PWC use over a one-week period in people with locomotor impairments, using an array of sensors embedded on the PWC, and 2) to explore the link between intensity measures and user-perceived PWC outcomes.
METHODS
Design
Multiple case studies
Participants
A convenience sample was recruited from a wheelchair clinic in Montreal. Inclusion criteria were: i) age 18 and over; ii) community living; iii) use of an Orthofab Oasis II powered wheelchair. Two women and one man, aged 46 to 56 years and who had been using a powered wheelchair for 4 to 13 years, agreed to take part in the study. All three participants were partly-ambulating.
Measures and Analysis
A monitoring system with multiple sensors connected to a tablet PC (Iotronix) through a 16 channels A/D card (National Instrument DaqCard 6024E) was used to record data continuously from the PWC for a period of seven days. Time spent sitting (min/hour) in the PWC was measured with two force sensitive resistors (FSR) positioned under the PWC cushion. Time spent driving (min/hour) was obtained from reading signals from the X- and Y- components of the joystick controller. Distance covered (km/hour) was measured with an optical wheel encoder positioned on one of the rear wheel of the PWC. Driving patterns were mapped with Goggle Earth from the data obtained from a GPS receiver positioned on the back of the PW. Sensors were powered by the A/D card. The tablet PC was connected to the power source of the wheelchair, and it ran dedicated data acquisition software (Labview) that sampled the data from the sensors at 250 Hz, 24 hours per day.
To calculate the time spent sitting, the signals from the two FSRs were first combined (root mean square averaging). A threshold was then visually set to distinguish between the “seated” and “not-seated” states. The amount of time when the combined FSR signal was above threshold was defined as time spent sitting. A similar procedure was performed for the joystick signals to calculate the time spent driving. The distance travelled was obtained by integrating the data from the wheel encoder. The GPS data was used to visually determine the number of places visited outside the home, with a place defined as a geographical location where the participant spent a significant amount of time. The places visited were identified as cluster of points on the GPS map, linked by relatively direct paths (see Fig 3).
User-perceived outcomes were obtained by interviews with four standardized questionnaires:
- the Life-Space Assessment (LSA) measures mobility range and use of technical and human assistance in five different environments (16). From a total of 20 items, three scores are generated: i) LS-M for maximal life-space with any type of assistance (0: confined to bedroom – 5: beyond town); ii) LS-E for maximal life-space without human assistance (0: confined to bedroom – 5: beyond town), and iii) LS-C as a composite score (0 to 120: higher scores indicate a larger life-space mobility range);
- the Wheelchair Outcome Measure (WhOM) (17) documents the mean importance of activities performed with the PWC and mean satisfaction with participation at home and in the community (scoring scales 0: not important/satisfied at all – 10: extremely important/satisfied);
- the Quebec User Satisfaction with Technology (QUEST) (18) computes a total score (0: not satisfied at all – 5: very satisfied) from 8 technology and 4 service items to measure satisfaction with the assistive device; and
- the 10-item version of the Psychosocial Impact of the Assistive Device Scale (PIADS-10) (19) comprises 10 self-rated questions related to the impact of the device on competence, adaptability, and self-esteem (score ranges from -3 to +3 on a 7 level scale; higher score=positive impact).
RESULTS
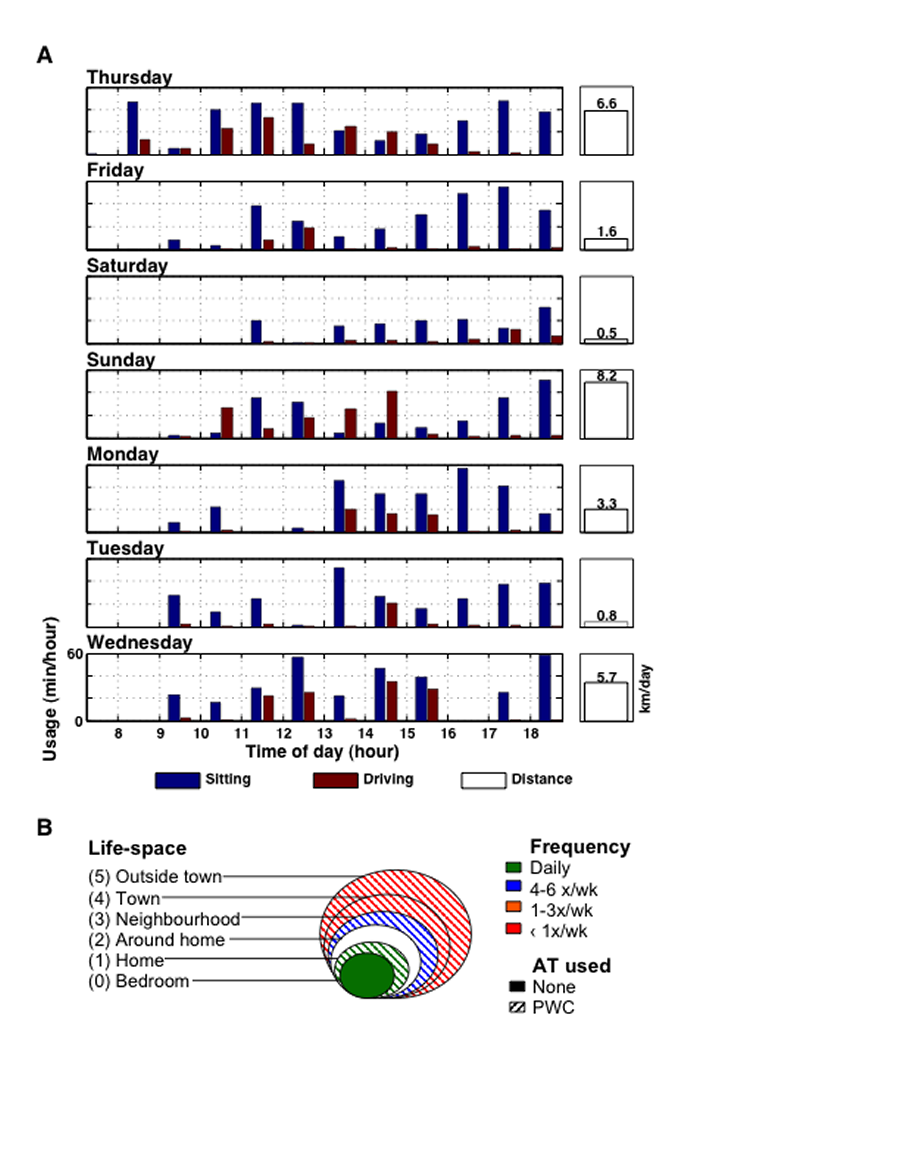
Figure 1: Daily usage and Life-space assessment for Participant #1. (Click for larger view)
Quality of the Data
In all three participants, data could be recorded continuously by the monitoring system for seven days. The quality of the FSR and joystick data was excellent, as thresholds could reliably be set to differentiate between the various states. For the FSR, the signal switched from 0V (not seated) to 5V (seated). Joystick signal changed by 2.5V with maximal excursion. The GPS data ranged from poor to excellent, which may have been due to the location of the receiver on the PWC or to greater indoor use by some participants, where reception is low or absent. With respect to the questionnaires, they were fully completed by all three participants.
Burden for the Participant
The installation of the monitoring system required a visit to the wheelchair clinic lasting three hours, during which the 30-minute interview took place. Removal required a 1-hour visit to the clinic a week later. The first participant experienced technical problems related to the connection of the monitoring system to the PWC’s power source. This required an additional visit to the clinic where the problem was corrected. All three participants reported inconveniences due to a faster battery discharge rate during the monitoring period.
Links Between Intensity Monitoring Measures and User-perceived Outcomes
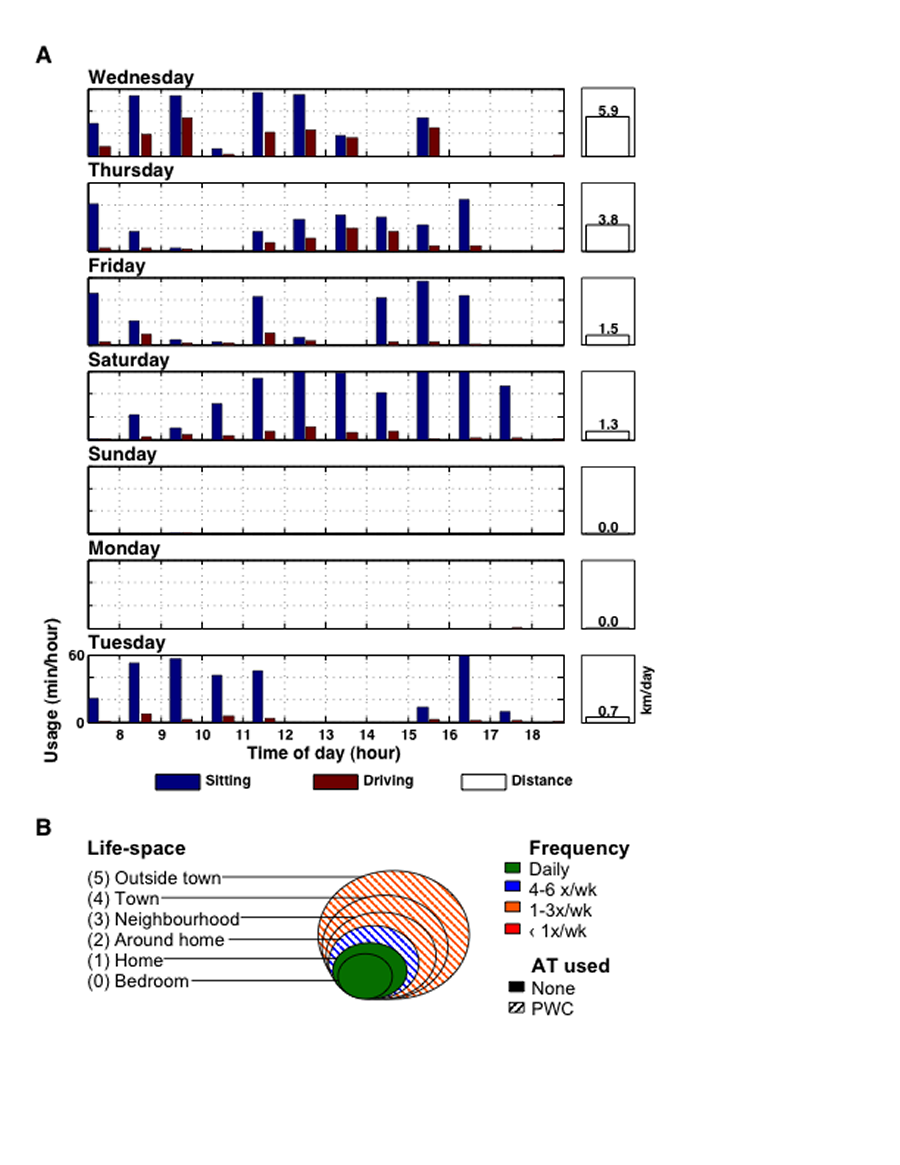
Figure 2: Daily usage and Life-space assessment for Participant #2. (Click for larger view)
Figures 1 and 2 show two contrasting examples of daily patterns of time spent sitting, time spent driving and distance travelled over the course of seven days. Figure 1A illustrates the monitoring of a part-time PWC user who operates the device exclusively outside the home environment, and Figure 2A shows daily data of a participant alternating between PWC and walking aids during the same day. Table 1 summarizes the questionnaire data for each participant.
Participant # |
1 |
2 |
3 |
Age |
56 |
46 |
55 |
PWC driving experience |
4 |
10 |
13 |
LSA |
42 |
46.5 |
49 |
WhOM home/community |
9/10 |
4/10 |
0*/8.8 |
QUEST technology/services |
4.1/4.5 |
4.0/3.3 |
3.6/3.8 |
PIADS |
+2.9 |
+1.2 |
+0.2 |
The exploration of the links between the intensity of PWC use and user-perceived outcomes showed that participant #1, who reported the most restricted life-space mobility (LSC=42/120) (Figure 2B, Table 1), spent the most time sitting and driving the PWC and travelled the most distance during the week (26.7 km) (Figure 2A) even if travel was mostly confined to the neighborhood. We counted 15 periods over 6 days where this participant sat in the PWC for more than 40 minutes. Peak driving time was over 40 minutes in one hour. The GPS readings were very well matched to the monthly LSA frequencies of PWC use in the neighbourhood (4-6x/wk) and in town or outside town (1-3x/wk). An example of the GPS tracking over a one-day period for this participant is displayed in Figure 3. Moreover, this participant expressed the highest PWC-related satisfaction, with QUEST items ranging from ‘more or less satisfied (3)’ to ‘very satisfied (5)’ for the technology items and from ‘quite satisfied (4)’ to ‘very satisfied (5)’ for the services received (Table 1). He perceived only positive psychosocial impacts following PWC use (PIADS score=2.9/3) and his wheelchair participation objectives were met at home and in the community, with mean satisfaction scores of 9 and above on the WhOM (Table 1).
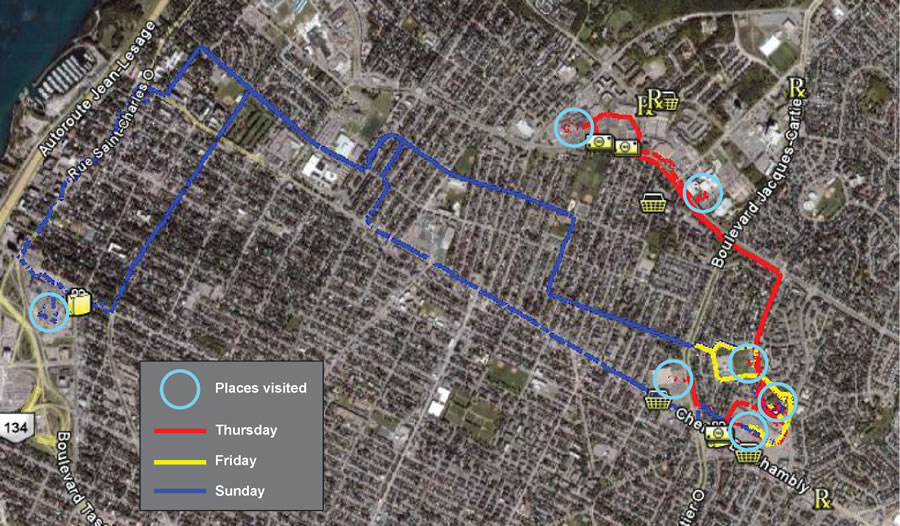
Figure 3: GPS map for participant #1. (Click for larger view)
On the other hand, participants #2 and #3 who used the PWC least regularly, that is 4 and 5 days out of 7 (Fig. 2), had the largest life-space mobility (LSA scores of 46.5 and 49) and they were more critical about their device with mean QUEST scores ranging from 3.3 to 4.0, for the technology- and services-related items (Table 1). They also reported some adverse psychosocial effects following PWC use on independence, self-esteem, feelings of control and ability to participate with others, despite an overall positive PIADS score. Wheelchair participation objectives were met in the community for both participants, with a mean satisfaction score of ~9/10 on the WhOM; there were no intentions of using the PWC at home for one user and a low satisfaction with wheelchair participation in the home for the other (4/10) (Table 1).
DISCUSSION AND CONCLUSION
This pilot study showed that it was possible to monitor PWC use with acceptable data quality over a period of one week. These preliminary results were limited to one model of PWC and to three part-time PWC users. Prior to involving multiple users with different PWC models for longer periods of time, the PWC monitoring system will be enhanced: the data acquisition system (Tablet PC with A/D card) will be replaced by a passive data logger to decrease costs and to save battery power. The sensor package will be revised so that it can be installed easily on any PWC.
The exploration of the links between the intensity of PWC use and participant-perceived outcomes showed that the intensity of PWC use was quite variable from day to day for three ambulatory participants. Daily use was associated to the most restricted life-space mobility and highest satisfaction with the device, as well as most positive psychosocial impacts. Based on the Model for predicting assistive technology use proposed by Lenker & Paquet (20), this could suggest that users who have less alternatives to move around are more satisfied with their device. On the other hand, dissatisfaction with the device and negative perceptions about the psychosocial impacts of the device could diminish the frequency with which the PWC is used. Since this data is cross-sectional and limited to three participants, we cannot make definitive interpretations. Despite some heterogeneity in intensity of PWC use, the three participants shared a high degree of satisfaction about the fulfillment of purposeful participation objectives in the community with the PWC. Since all three participants were long-term PWC users, it appears that satisfaction with participation can be preserved even if some aspects of the device and some adverse psychosocial impacts are perceived.
In the future, this monitoring system will allow the tracking of the natural history of PWC driving, from the initial training period to expert use. It will enable intra-subject and inter-subject comparisons across time, with validated and observable data about driving habits and user-perceived outcomes.
REFERENCES
- Wessels R, Dijcks B, Soede M, Gelderblom G, De Witte L. Non-use of provided assistive technology devices, a litterature overview. Technology and Disability. 2003;15:231-8.
- Trail M, Nelson N, Van JN, Appel SH, Lai EC. Wheelchair use by patients with amyotrophic lateral sclerosis: a survey of user characteristics and selection preferences. Arch Phys Med Rehabil. 2001 Jan;82(1):98-102.
- Sonenblum SE, Sprigle S, Harris FH, Maurer CL. Characterization of power wheelchair use in the home and community. Arch Phys Med Rehabil. 2008 Mar;89(3):486-91.
- Pettersson I, Tornquist K, Ahlstrom G. The effect of an outdoor powered wheelchair on activity and participation in users with stroke. Dis Rehabil Assist Technol. 2006;1(4):235 - 43.
- Cooper RA, Thorman T, Cooper R, Dvorznak MJ, Fitzgerald SG, Ammer W, et al. Driving characteristics of electric-powered wheelchair users: how far, fast, and often do people drive? Arch Phys Med Rehabil. 2002 Feb;83(2):250-5.
- Phillips B, Zhao H. Predictors of assistive technology abandonment. Assist Technol. 1993;5(1):36-45.
- Clemson L, Fitzgerald MH. Understanding assessment concepts within the occupational therapy context. Occup Ther Int. 1998;5(1):18-34.
- Garber S, Bunzel R, Monga T. Wheelchair utilization and satisfaction following cerebral vascular accident. J Rehabil Res Dev. 2002 July/August;39(4):521-34.
- Mann WC, Goodall S, Justiss MD, Tomita M. Dissatisfaction and nonuse of assistive devices among frail elders. Assist Technol. 2002 Winter;14(2):130-9.
- Gitlin LN, Luborsky MR, Schemm RL. Emerging concerns of older stroke patients about assistive device use. Gerontologist. 1998 Apr;38(2):169-80.
- Agree EM, Freedman VA, Sengupta M. Factors influencing the use of mobility technology in community-based long-term care. J Aging Health. 2004;16(2):267-307.
- Brandt A, Iwarsson S, Stahle A. Older people's use of powered wheelchairs for activity and participation. J Rehabil Med. 2004 Mar;36(2):70-7.
- Meyers AR, Anderson JJ, Miller DR, Shipp K, Hoenig H. Barriers, facilitators, and access for wheelchair users: substantive and methodologic lessons from a pilot study of environmental effects. Soc Sci Med. 2002 Oct;55(8):1435-46.
- Mollenkopf H, Marcellini F, Ruoppila I, Flaschentrager P, Gagliardi C, Spazzafumo L. Outdoor mobility and social relationships of elderly people. Arch Gerontol Geriatr. 1997 May-Jun;24(3):295-310.
- Hoenig H, Pieper C, Branch LG, Cohen HJ. Effect of motorized scooters on physical performance and mobility: a randomized clinical trial. Arch Phys Med Rehabil. 2007 Mar;88(3):279-86.
- Baker PS, Bodner EV, Allman RM. Measuring life-space mobility in community-dwelling older adults. J Am Geriatr Soc. 2003 Nov;51(11):1610-4.
- Mortenson B, Miller W, Miller-Polgar J. Measuring Wheelchair Intervention Outcomes: Development of the Wheelchair Outcome Measure. Dis Rehabil Assist Technol. 2007 September;2(5):265-85.
- Demers L, Monette M, Lapierre Y, Arnold D, Wolfson C. Reliability, validity, and applicability of the Quebec User Evaluation of Satisfaction with assistive Technology (QUEST 2.0) for adults with multiple sclerosis. Disabil Rehabil. 2002;24(1-3):21-30.
- Jutai J, Day H, Coulson S, Demers L, Fuhrer M, Lenker JA, et al. Developing a Short Form of the Psychosocial Impact of Assistive Devices Scale (PIADS). RESNA. Phoenix, Arizona; 2007.
- Lenker JA, Paquet VL. A new conceptual model for assistive technology outcomes research and practice. Assist Technol. 2004 Summer;16(1):1-10.
ACKNOWLEDGEMENTS
We wish to thank the participants for their trust and compliance, as well as Danielle Dessureault, OT, MBA, for her help in the project,Jacqueline Nguyen and Angela Kim for data collection. This study was supported by grants from the Centre for Interdisciplinary Research in Rehabilitation of Greater Montreal, Canada (CRIR) as well as the Natural Science and Engineering Council, Canada (NSERC).
Author address:
Philippe Archambault, OT, PhD
School of Physical & Occupational Therapy
McGill University
3654 Promenade Sir-William-Osler
Montreal QC H3G 1Y5, Canada
+1 514 398-7323